


SAMHSA list pulled November 16, 2026
How far is treatment from each Kentucky county?
We started at the center of every one of Kentucky's 120 counties. Next, we counted the miles to each closest site: detox, live-in program, medicine clinic. Detox is more than 30 miles off in 31 counties. 611,858 people live there. 15 counties have not a single treatment site.
Get the insurance card out and note the ZIP code, yours or a loved one's. A partner takes calls on this paid referral line, not the programs on this site.
All 120 counties
Listed from nearest detox to farthest. Miles are measured in a straight line. Expect a longer drive.
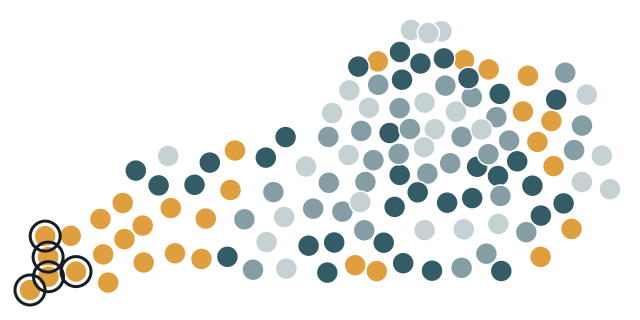
- up to 10 mi 25
- 10–20 mi 30
- 20–30 mi 34
- over 30 mi 31
- Farthest: Fulton 125 mi, Hickman 111 mi, Carlisle 102 mi, Graves 97 mi, Ballard 95 mi
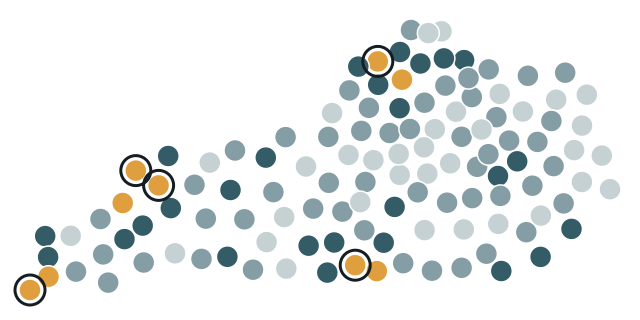
- up to 10 mi 34
- 10–20 mi 51
- 20–30 mi 26
- over 30 mi 9
- Farthest: Union 48 mi, Fulton 44 mi, Cumberland 38 mi, Webster 37 mi, Carroll 37 mi
| County | Population 2024 | Programs in this county | Detox, mi | Residential, mi | MAT, mi |
|---|---|---|---|---|---|
| Fulton County | 6,282 | 0 | 125.4 | 44.1 | 44.1 |
| Hickman County | 4,393 | 0 | 111.0 | 30.4 | 30.4 |
| Carlisle County | 4,777 | 0 | 102.4 | 23.5 | 21.2 |
| Graves County | 36,821 | 3 | 97.0 | 12.3 | 12.3 |
| Ballard County | 7,626 | 0 | 95.4 | 20.8 | 17.1 |
| Calloway County | 38,975 | 5 | 92.6 | 12.1 | 1.8 |
| McCracken County | 67,550 | 10 | 82.5 | 4.4 | 1.3 |
| Marshall County | 31,734 | 2 | 78.1 | 10.9 | 3.1 |
| Trigg County | 14,559 | 1 | 73.1 | 19.4 | 19.8 |
| Lyon County | 9,078 | 0 | 62.9 | 27.2 | 10.9 |
| Livingston County | 8,815 | 0 | 61.1 | 16.2 | 15.5 |
| Christian County | 71,006 | 9 | 54.9 | 1.4 | 0.4 |
| Caldwell County | 12,611 | 2 | 50.5 | 27.1 | 3.8 |
| Crittenden County | 8,982 | 0 | 44.0 | 33.7 | 20.2 |
| Hancock County | 9,013 | 1 | 43.2 | 17.1 | 15.7 |
| Lewis County | 12,875 | 1 | 40.1 | 16.6 | 16.6 |
| Todd County | 12,757 | 0 | 38.9 | 14.7 | 14.9 |
| Cumberland County | 6,047 | 0 | 38.5 | 38.4 | 15.8 |
| Ohio County | 23,933 | 2 | 38.4 | 20.6 | 20.6 |
| Muhlenberg County | 30,512 | 5 | 37.9 | 14.4 | 5.1 |
| Clinton County | 9,183 | 2 | 37.4 | 31.6 | 2.4 |
| Hopkins County | 45,218 | 4 | 36.9 | 29.8 | 2.8 |
| Morgan County | 14,300 | 2 | 36.5 | 18.1 | 13.8 |
| Mason County | 16,956 | 4 | 36.0 | 12.7 | 5.1 |
| Elliott County | 7,263 | 1 | 35.3 | 13.2 | 2.3 |
| Harlan County | 25,052 | 3 | 35.2 | 26.1 | 6.1 |
| Carroll County | 11,111 | 3 | 32.1 | 36.6 | 1.8 |
| Letcher County | 20,139 | 5 | 32.0 | 22.9 | 5.6 |
| Bracken County | 8,497 | 0 | 31.9 | 26.5 | 11.8 |
| Rowan County | 24,675 | 9 | 30.5 | 1.5 | 1.5 |
| Magoffin County | 11,118 | 2 | 30.2 | 10.6 | 16.3 |
| Breckinridge County | 21,221 | 2 | 30.0 | 27.1 | 22.2 |
| Wolfe County | 6,364 | 2 | 29.0 | 28.5 | 3.4 |
| Fleming County | 15,591 | 2 | 28.5 | 4.7 | 15.9 |
| Metcalfe County | 10,558 | 1 | 28.4 | 28.8 | 15.6 |
| Daviess County | 104,457 | 12 | 28.3 | 2.9 | 1.4 |
| McLean County | 9,126 | 1 | 28.0 | 19.5 | 16.1 |
| Monroe County | 11,163 | 1 | 27.0 | 27.0 | 1.6 |
| Bell County | 23,051 | 5 | 26.4 | 27.4 | 7.9 |
| Owen County | 11,435 | 1 | 26.4 | 35.4 | 19.9 |
| Lincoln County | 24,910 | 1 | 25.8 | 14.4 | 6.3 |
| Rockcastle County | 16,226 | 1 | 25.7 | 18.8 | 1.0 |
| Trimble County | 8,591 | 0 | 25.6 | 27.1 | 10.6 |
| McCreary County | 16,824 | 2 | 25.5 | 18.7 | 1.1 |
| Grant County | 25,722 | 2 | 25.0 | 24.0 | 15.9 |
| Lee County | 7,313 | 1 | 25.0 | 25.0 | 2.1 |
| Pendleton County | 14,844 | 1 | 25.0 | 22.5 | 1.7 |
| Breathitt County | 12,804 | 3 | 24.7 | 17.3 | 1.6 |
| Carter County | 26,098 | 8 | 24.7 | 6.6 | 6.0 |
| Boyle County | 31,394 | 5 | 24.5 | 5.5 | 4.5 |
| Russell County | 18,458 | 1 | 24.5 | 22.3 | 1.8 |
| Robertson County | 2,382 | 0 | 24.1 | 17.8 | 18.4 |
| Knott County | 13,438 | 6 | 24.0 | 16.0 | 4.7 |
| Union County | 13,178 | 1 | 23.8 | 47.6 | 23.8 |
| Casey County | 15,948 | 1 | 23.3 | 22.6 | 0.6 |
| Webster County | 12,854 | 2 | 23.0 | 36.8 | 16.4 |
| Logan County | 28,467 | 1 | 22.6 | 22.2 | 22.2 |
| Wayne County | 19,629 | 4 | 22.5 | 15.2 | 2.3 |
| Gallatin County | 8,805 | 1 | 22.4 | 24.0 | 2.8 |
| Jackson County | 13,358 | 1 | 22.2 | 18.3 | 3.0 |
| Perry County | 26,739 | 11 | 22.2 | 2.2 | 2.2 |
| Meade County | 30,442 | 1 | 22.0 | 16.1 | 22.0 |
| Barren County | 45,609 | 5 | 21.0 | 21.0 | 3.2 |
| Estill County | 14,002 | 1 | 21.0 | 19.8 | 0.9 |
| Anderson County | 24,883 | 1 | 20.4 | 14.8 | 5.1 |
| Lawrence County | 15,798 | 6 | 20.0 | 7.8 | 5.8 |
| Madison County | 99,582 | 6 | 19.4 | 3.5 | 0.7 |
| Menifee County | 6,341 | 1 | 18.6 | 17.6 | 14.4 |
| Butler County | 12,551 | 2 | 17.8 | 10.8 | 10.8 |
| Henry County | 16,198 | 0 | 17.8 | 27.2 | 14.3 |
| Johnson County | 22,098 | 6 | 17.8 | 6.1 | 3.1 |
| Garrard County | 18,040 | 2 | 17.5 | 8.5 | 8.5 |
| Mercer County | 23,515 | 1 | 17.5 | 2.3 | 14.2 |
| Greenup County | 35,273 | 2 | 17.4 | 13.6 | 10.9 |
| Leslie County | 9,729 | 3 | 17.3 | 12.5 | 4.8 |
| Franklin County | 52,442 | 6 | 17.0 | 22.1 | 4.2 |
| Harrison County | 19,525 | 2 | 16.8 | 16.3 | 16.1 |
| Simpson County | 20,350 | 1 | 16.8 | 16.8 | 16.8 |
| Adair County | 19,239 | 3 | 16.6 | 16.3 | 1.4 |
| Washington County | 12,269 | 3 | 16.5 | 4.4 | 5.8 |
| Nicholas County | 7,816 | 0 | 16.2 | 14.1 | 16.2 |
| Grayson County | 27,070 | 3 | 16.1 | 16.1 | 2.9 |
| Hart County | 19,923 | 2 | 16.1 | 16.1 | 2.5 |
| Marion County | 19,851 | 2 | 15.6 | 10.9 | 10.9 |
| Bath County | 12,951 | 2 | 14.8 | 12.6 | 1.7 |
| Larue County | 15,128 | 1 | 14.3 | 14.2 | 14.3 |
| Woodford County | 27,728 | 1 | 14.2 | 11.1 | 2.0 |
| Whitley County | 37,233 | 10 | 14.0 | 10.8 | 1.0 |
| Powell County | 12,928 | 2 | 13.7 | 13.7 | 11.3 |
| Spencer County | 20,823 | 1 | 13.6 | 10.3 | 1.6 |
| Knox County | 29,657 | 4 | 12.5 | 14.5 | 2.7 |
| Bullitt County | 85,802 | 3 | 12.4 | 10.6 | 12.4 |
| Clark County | 37,673 | 7 | 12.3 | 12.3 | 2.3 |
| Owsley County | 3,928 | 0 | 12.2 | 12.2 | 11.1 |
| Green County | 11,552 | 1 | 10.8 | 11.6 | 10.8 |
| Floyd County | 34,532 | 10 | 9.8 | 7.3 | 7.3 |
| Oldham County | 70,525 | 3 | 9.3 | 11.0 | 4.2 |
| Campbell County | 94,008 | 4 | 8.9 | 8.8 | 8.8 |
| Pike County | 55,430 | 12 | 8.8 | 7.0 | 4.2 |
| Boyd County | 47,777 | 15 | 8.4 | 6.7 | 6.7 |
| Clay County | 19,592 | 2 | 8.1 | 8.1 | 8.1 |
| Boone County | 144,135 | 4 | 7.7 | 11.1 | 4.6 |
| Scott County | 61,700 | 4 | 6.9 | 16.6 | 5.3 |
| Kenton County | 174,862 | 15 | 6.4 | 4.0 | 2.0 |
| Laurel County | 63,353 | 10 | 6.4 | 2.4 | 2.1 |
| Edmonson County | 12,635 | 2 | 4.1 | 4.1 | 3.7 |
| Martin County | 10,696 | 2 | 3.8 | 3.8 | 16.0 |
| Hardin County | 112,826 | 16 | 3.7 | 4.7 | 3.7 |
| Henderson County | 44,175 | 5 | 3.6 | 26.2 | 3.6 |
| Jefferson County | 793,881 | 44 | 3.6 | 3.5 | 1.2 |
| Bourbon County | 20,333 | 4 | 3.4 | 2.0 | 3.4 |
| Pulaski County | 66,842 | 7 | 3.2 | 2.1 | 2.4 |
| Montgomery County | 28,771 | 3 | 3.0 | 1.4 | 1.4 |
| Taylor County | 26,809 | 5 | 2.5 | 2.1 | 0.9 |
| Nelson County | 48,706 | 4 | 2.3 | 2.3 | 2.3 |
| Warren County | 147,936 | 14 | 2.3 | 2.3 | 0.6 |
| Shelby County | 50,124 | 2 | 2.1 | 18.2 | 2.1 |
| Jessamine County | 56,495 | 5 | 1.0 | 1.0 | 1.0 |
| Allen County | 22,037 | 2 | 0.4 | 0.4 | 0.4 |
| Fayette County | 329,437 | 40 | 0.4 | 4.0 | 0.2 |
Don't know the first step?
Can't decide on a program? Call the referral line below, or reach out to a listed program on your own.
A partner takes calls on this paid referral line, not the programs on this site.
Method
We take facilities from SAMHSA FindTreatment.gov: all Kentucky listings that report detox or substance use treatment (snapshot November 16, 2026). County centers come from the 2024 U.S. Census Bureau Gazetteer. Population comes from 2024 Census estimates. ZIP code decides each facility's county (the Census ZCTA-to-county file). Distances are in great-circle miles. Each runs from a county's internal point to the listed coordinates of the facility; when a SAMHSA listing lacks coordinates, the Census Geocoder places it by address; with no street given, it goes to the ZIP code center. MAT includes certified opioid treatment programs (OTP). Feel free to reuse the data; link to this page.